Dectection is one of the most critical stages of the Information Security processes. There will always be some new zero day exploit, so the ability to detect when an attack is operating on your network is critical.
The Atomic Red Team is an attack emulation toolkit to help you measure, monitor and improve your detection capabilities.
I wanted to build out an active directory lab environment to explore this toolkit and the detection capabilities of various logging systems. It’s going to be a very bare bones network, but should be enough to experiment with the framework.
Hardware
I’m going to run the lab virtually inside of an ESXi host running on a Dell R720. A lot of the systems are running Elasticsearch stacks – which are VERY RAM intensive and this system has 128GB of RAM available.
Logging and Detection Systems
The first detection system I’m going to look at is Hunting ELK. HELK is an opensource hunting platform based on ElasticSearch, Logstash and Kibana. I’m planning on looking at Log360, ActiveCounterMeansure BeaKer and the Free Tier of Splunk. If you have any other suggestions of log monitor/aggregation platforms let me know by leaving a comment or on Twitter.
Lab Systems
For the router, I’m going with vyOS. It’s a CLI firewall and routing platform.
For the Windows side of the network, I’m going to set up a Domain Controller and a Windows 10 Workstation. Some of the Atomic tests are Linux specific, so I’m going to include a Linux Workstation as well. These systems are going to be from the Microsoft Evaluation Center.
In addition to the system logs, I want to be able to observe Network traffic for Atomic tests that traverse the network. To that end, I’m going to set up an Intrusion Detection System (IDS) and experiment with SecurityOnion2, Suricata and the Emerging Threat ruleset to start with.
| Device | Operating System | vCPU | RAM | Hard Drive | IP |
|---|---|---|---|---|---|
| Router | vyOS | 1 | 512 MB | 4 GB | 10.20.0.1 |
| IDS | SecurityOnion 2 | 8 | 12 GB | 500 GB | 10.20.0.200 |
| Logging System | HELK | 6 | 8 GB | 500 GB | 10.20.0.210 |
| Domain Controller | Windows Server 2019 | 2 | 4 GB | 40 GB | 10.20.0.10 |
| Windows Workstation | Windows 10 Enterprise | 2 | 4 GB | 32 GB | 10.20.0.100 |
| Linux Workstation | Ubuntu 20.04 | 2 | 2 GB | 32 GB | 10.20.0.150 |
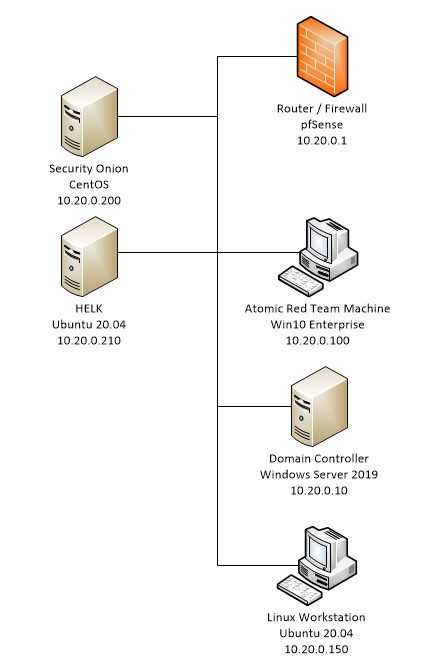
Network Diagram
I’m going with a basic flat network layout. Not the most secure, but should be easy to monitor the network.
Installation Process
I’m going to do a walk through on what I did to create the lab above. In this first installment, I’m going to walk through on creating the network environment. Each of the other components will be split out into their own posts so this isn’t one mega post.
Networking
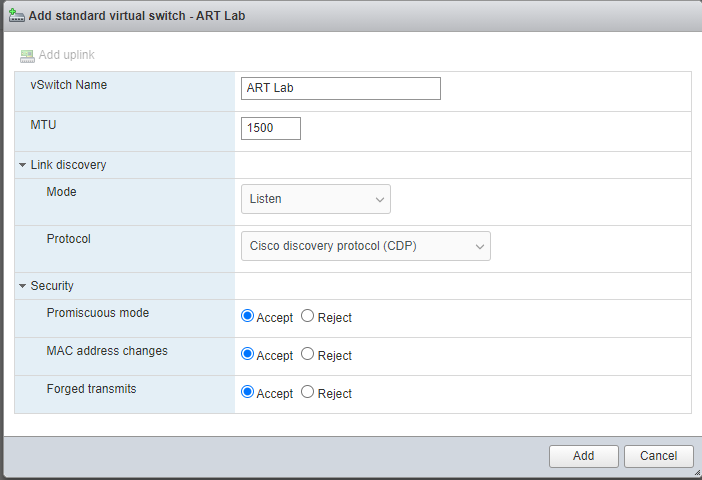
Since I’m running the labs on ESXi, I need to create a Virtual Switch and a Port Group. A Virtual Switch (or vSwitch), is a connection between the Virtual Machine and a Physical Network Interface. It operates at Layer 2 of the OSI Model just ike a hardware switch. However, there are some differences.
- The vSwitch doesn’t keep a MAC address table like a hardware switch
- The vSwitch doesn’t flood unknown frames out to all ports, it simply drops unknown frames
- The vSwitch only cares about the MAC addresses from the VMs directly connected to vSwitch
On the Virtual Switch I need to enable MAC Address changes, Promiscuous Mode and Forged Transmits.
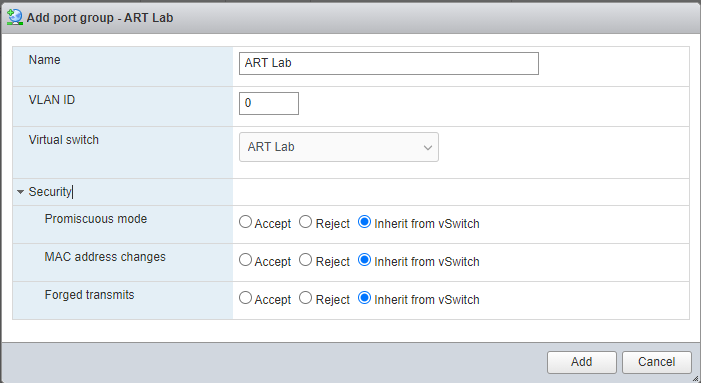
After the Virtual Switch, we need to configure Port Groups. Port Groups allow you to group the virtual ports on the vSwitch. Traffic policy rules are applied at the Port Group level. In this lab, we’re not doing much at the switching level, so we’ll just inherit the settings from the vSwitch.
Additional Installations
You can continue following the series here. Links will be updated as they are ready.
- Router installation and Configuration – vyOS
- IDS installation and Configuration – Security Onion
- Log Monitoring installation and Configuration – HELK
- Active Directory Domain Controller Installation and Configuration – Windows 2019 Server
- Windows Workstation Installation and Configuration – Windows 10 Enterprise
- Linux Workstation Installation and Configuration – Ubuntu 20.04 [In progress]
- Atomic Red Team Starter Set of Tests [In progress]
- HELK Starter Set Results [In Progress]
- SecurityOnion Starter Set Results [Not yet started]
- Log360 Starter Set Results [Not yet started]
- Beaker Starter Set Results [Not yet started]
Leave a Reply